

Why are insurance costs rising for drivers?
Nationwide trends are impacting many industries, including insurance.
Not only are home insurance rates rising, but auto insurance rates are also increasing. Even with a clean driving record and no recent claims, you may see a higher premium for your auto insurance.
How are auto insurance rates determined?
There are several standard factors that influence auto insurance premiums. Rates are determined by the likelihood of a consumer filing a claim and the possible risks involved. Auto insurance rates are also driven by:
- Level of insurance coverage needed
- Number of car insurance claims
- Deductible amount
- Demographics
- Driving history
- Location
There are other influencers caused by national trends which also contribute to rates, the biggest cause being the rise in inflation. When prices rise, the cost of living and owning a car increases, which in turn influences auto insurance rates. These rate increases are happening to insurance companies across the U.S.
We have put together an overview of some current trends to help show you what is causing auto insurance rates to rise. An infographic of Why are insurance costs rising for drivers? is also available.
Jump to: More demand | More expensive | More rentals | More technology | More claims | More distracted | More fatigued | More fatalities
More demand
Once buying habits started to change after the uncertainty of 2020, the auto industry was unable to keep up with consumer demand due to semiconductor chip shortages and supply chain issues. New cars became harder to find and inventory was scarce. This combination of events caused prices for new cars to increase. With less new cars for sale, there has become a shortage of used cars, which saw an even greater price jump.
- Prices for used cars are up a staggering 39.8% since March of 2020, according to the U.S. Bureau of Labor Statistics’ Consumer Price Index. The BLS inflation measurement for new car prices during that same period is up 8.9%.1
- An estimated 57% of new cars sold within 10 days of being delivered in December 2021, as reported by J.D. Power. Additionally, the time it takes for a new car to sell is averaging a new low of 17 days, down from 49 days in 2020.2
- Demand for used cars is also up, as costs have risen to an average of $29,011, up 27.9% from 2020, according to Edmunds’ data.3
More expensive
As a result of more demand and less cars available for purchase, a larger number of drivers have taken to repairing their existing vehicles rather than opting for a new model. Repair costs, however, have also gone up. Older cars face higher repair prices as well as additional maintenance services. Also, a shrinking labor market due to retirement is driving up labor costs.
- The average total cost of vehicle repairs has climbed 22% over the past five years, jumping from $2,858 in March 2016 to $3,480 in February 2021.4
- Labor increased 1.5 hours per claim with an average hourly rate increase of 8.2%.5
- Windshield prices are up 15%, hoods increased 9%, lift gates 8% and front bumpers and fenders increased 7%.6
- According to the 2020 Transportation Technician Supply & Demand Report at TechForce Foundation, the supply of auto repair technicians has fallen behind demand by 3 to 1. The report estimates that 642,000 technicians will be needed between 2020 and 2024, with an inadequate pipeline of new trainees filling this demand.7
More rentals
With a nationwide shortage of cars to purchase, rental fleets have also been struggling. The supply chain issues and chip shortages have led rental agencies to bid for cars and compete with consumer demand. With smaller fleets, there are less cars to rent, leading to higher rental prices.
- Data from travel company Kayak reveals that the average daily rental rate for a car in the U.S. in December 2021 was $81. That is up 31% from the year prior and up even more since December 2019 when the average rental rate was around $46.8
- Auto Rental News reports that a total of 726,056 new cars were added to the U.S. rental car industry throughout 2021. This is only a 9% drop from 2020 but is a 58% drop from 2019 when the industry added almost 1,739,000 new vehicles.9
More technology
Cars are becoming more advanced each year. Electric vehicles with wireless charging stations are everywhere. Some newer cars have xenon headlights, 360-degree cameras, emergency braking with pedestrian detection, direct adaptive steering and more. All these technological breakthroughs add to the price of a vehicle and factor into replacement costs in the event of a loss.
- High-tech auto parts (xenon headlights, sensors, cameras, etc.) have resulted in an average increase in claim costs of almost $300 in the last 5 years.10
More claims
An increase in auto accidents has resulted in more and higher claims filed. With complex vehicle technology, replacement parts are becoming more expensive. Much of the price increases are due to supply chain disruptions and worker shortages. This has resulted in total loss costs at some of the highest levels they’ve been at in years.
- Over a 5-year period, total loss frequency has climbed 4.1%.11
- According to a report by CCC Intelligent Solutions, the percentage of collision claims where the vehicle was rendered non-drivable was greater in every month of 2021 compared the same month in 2020 and 2019. The increase was even more evident for liability claims, where the percentage of non-drivable accidents was nearly 25% during much of 2021, compared to about 20 to 21% in 2019.12
- CCC shows that the average total loss claim cost climbed from slightly less than $8,000 in 2010 to slightly less than $10,000 in 2020, then jumped to more than $12,000 in 2021.The steady increase in vehicle replacement cost has been attributed to the growing complexity of automobiles during that time period.13
- Vehicles are also taking longer to repair. Repair shops were reported to have a backlog of 2.6 weeks during the third quarter of 2021, which was a week longer than in the second quarter of 2021. During the third quarter of 2019, the average backlog was 1.7 weeks.14
More distracted
Taking your eyes off the road while driving, for even a few seconds, can have disastrous consequences. The rising number of drivers who text while they are driving not only causes harm to other drivers but has led to higher auto insurance rates.
- 660,000 Americans are using cell phones or electronic devices while driving—at any given daytime moment.15
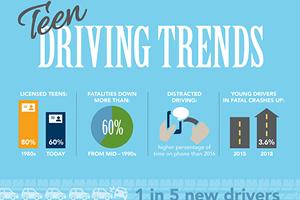
- Teen drivers and young adults are at the greatest risk for distracted driving. Among drivers involved in fatal crashes, drivers age 15 to 19 were most likely to be distracted, according to NHTSA.16
- Most U.S. states have legislation banning the use of cell phones while driving instead of broader bans on distracted driving. Twenty-four states ban the use of handheld devices while driving, 20 states ban cell phone use while driving and 48 states ban texting. Missouri and Montana are the two states that don’t ban texting while behind the wheel.17
More fatigued
Drowsy driving, or driver fatigue, is the act of operating a motor vehicle when the driver is tired and has not had enough sleep. Medications, untreated sleep disorders and unpredictable sleep or work schedules can also contribute to driving while fatigued. Reaction time, inability to focus, judgment of speed and/or distance are some of the main effects of driving while sleepy.
- According to the National Highway Traffic Safety Administration, police report around 100,000 drowsy driving crashes annually, resulting in 50,000 injuries and 800 fatalities.18
- However, a study by the AAA Foundation for Traffic Safety concluded that 328,000 drowsy driving crashes happen each year. This is more than three times the number of crashes reported by police.19
- Injuries were recorded in 109,000 of those drowsy driving crashes reported and 6,400 of the crashes were fatal. The prevalence of drowsy driving fatalities is more than 350% greater than reported, according to researchers.20
More fatalities
Despite a reduction in driving early-on in the pandemic, consumers got back on the roads when they could, in record numbers. Incidents of speeding and driving without a seatbelt were reported to be higher than before the pandemic, contributing to a rise in fatalities. Between January and June 2021, the U.S. Department of Transportation’s National Highway Traffic Safety Administration reported the largest six-month increase ever recorded in the Fatality Analysis Reporting System’s history.
- From January through November 2021, the number of deaths is estimated to be 42,310. This estimate is up 9% compared to 2020 and up 18% compared to 2019.21
- The surge in motor vehicle deaths marks the largest increase in fatalities since 1940s and a sharp change from 2019, where the annual death rate was near its lowest level since the 1920s.22
Working with an independent agent will help ensure you have coverage that’s the right combination of price, protection and value with The Hanover’s suite of products. By bundling your coverage with Hanover Platinum or Hanover Prestige (for higher-value vehicles), you can have product suites that fit your needs and help you stay protected.
Questions? Contact your independent agent to learn more.
Sources
[1] Fortune [2-3] CNBC [4-6] CCC Intelligent Solutions industry update – August 2021 [7] TechForce Foundation [8] Car & Driver [9] Auto Rental News [10] Mitchell [11-13] CCC Intelligent Solutions industry update – August 2021 [14] Claims Journal [15-16] NHTSA survey [17] Bankrate [18] NSC [19] AAA Foundation for Traffic Safety [20] NSC [21] NSC Injury facts – Nov 2021 [22] New York Times
Related resources

Why are insurance costs rising for drivers?
Nationwide trends are impacting many industries, including insurance.
Not only are home insurance rates rising, but auto insurance rates are also increasing. Even with a clean driving record and no recent claims, you may see a higher premium for your auto insurance.
How are auto insurance rates determined?
There are several standard factors that influence auto insurance premiums. Rates are determined by the likelihood of a consumer filing a claim and the possible risks involved. Auto insurance rates are also driven by:
- Level of insurance coverage needed
- Number of car insurance claims
- Deductible amount
- Demographics
- Driving history
- Location
There are other influencers caused by national trends which also contribute to rates, the biggest cause being the rise in inflation. When prices rise, the cost of living and owning a car increases, which in turn influences auto insurance rates. These rate increases are happening to insurance companies across the U.S.
We have put together an overview of some current trends to help show you what is causing auto insurance rates to rise. An infographic of Why are insurance costs rising for drivers? is also available.
Jump to: More demand | More expensive | More rentals | More technology | More claims | More distracted | More fatigued | More fatalities
More demand
Once buying habits started to change after the uncertainty of 2020, the auto industry was unable to keep up with consumer demand due to semiconductor chip shortages and supply chain issues. New cars became harder to find and inventory was scarce. This combination of events caused prices for new cars to increase. With less new cars for sale, there has become a shortage of used cars, which saw an even greater price jump.
- Prices for used cars are up a staggering 39.8% since March of 2020, according to the U.S. Bureau of Labor Statistics’ Consumer Price Index. The BLS inflation measurement for new car prices during that same period is up 8.9%.1
- An estimated 57% of new cars sold within 10 days of being delivered in December 2021, as reported by J.D. Power. Additionally, the time it takes for a new car to sell is averaging a new low of 17 days, down from 49 days in 2020.2
- Demand for used cars is also up, as costs have risen to an average of $29,011, up 27.9% from 2020, according to Edmunds’ data.3
More expensive
As a result of more demand and less cars available for purchase, a larger number of drivers have taken to repairing their existing vehicles rather than opting for a new model. Repair costs, however, have also gone up. Older cars face higher repair prices as well as additional maintenance services. Also, a shrinking labor market due to retirement is driving up labor costs.
- The average total cost of vehicle repairs has climbed 22% over the past five years, jumping from $2,858 in March 2016 to $3,480 in February 2021.4
- Labor increased 1.5 hours per claim with an average hourly rate increase of 8.2%.5
- Windshield prices are up 15%, hoods increased 9%, lift gates 8% and front bumpers and fenders increased 7%.6
- According to the 2020 Transportation Technician Supply & Demand Report at TechForce Foundation, the supply of auto repair technicians has fallen behind demand by 3 to 1. The report estimates that 642,000 technicians will be needed between 2020 and 2024, with an inadequate pipeline of new trainees filling this demand.7
More rentals
With a nationwide shortage of cars to purchase, rental fleets have also been struggling. The supply chain issues and chip shortages have led rental agencies to bid for cars and compete with consumer demand. With smaller fleets, there are less cars to rent, leading to higher rental prices.
- Data from travel company Kayak reveals that the average daily rental rate for a car in the U.S. in December 2021 was $81. That is up 31% from the year prior and up even more since December 2019 when the average rental rate was around $46.8
- Auto Rental News reports that a total of 726,056 new cars were added to the U.S. rental car industry throughout 2021. This is only a 9% drop from 2020 but is a 58% drop from 2019 when the industry added almost 1,739,000 new vehicles.9
More technology
Cars are becoming more advanced each year. Electric vehicles with wireless charging stations are everywhere. Some newer cars have xenon headlights, 360-degree cameras, emergency braking with pedestrian detection, direct adaptive steering and more. All these technological breakthroughs add to the price of a vehicle and factor into replacement costs in the event of a loss.
- High-tech auto parts (xenon headlights, sensors, cameras, etc.) have resulted in an average increase in claim costs of almost $300 in the last 5 years.10
More claims
An increase in auto accidents has resulted in more and higher claims filed. With complex vehicle technology, replacement parts are becoming more expensive. Much of the price increases are due to supply chain disruptions and worker shortages. This has resulted in total loss costs at some of the highest levels they’ve been at in years.
- Over a 5-year period, total loss frequency has climbed 4.1%.11
- According to a report by CCC Intelligent Solutions, the percentage of collision claims where the vehicle was rendered non-drivable was greater in every month of 2021 compared the same month in 2020 and 2019. The increase was even more evident for liability claims, where the percentage of non-drivable accidents was nearly 25% during much of 2021, compared to about 20 to 21% in 2019.12
- CCC shows that the average total loss claim cost climbed from slightly less than $8,000 in 2010 to slightly less than $10,000 in 2020, then jumped to more than $12,000 in 2021.The steady increase in vehicle replacement cost has been attributed to the growing complexity of automobiles during that time period.13
- Vehicles are also taking longer to repair. Repair shops were reported to have a backlog of 2.6 weeks during the third quarter of 2021, which was a week longer than in the second quarter of 2021. During the third quarter of 2019, the average backlog was 1.7 weeks.14
More distracted
Taking your eyes off the road while driving, for even a few seconds, can have disastrous consequences. The rising number of drivers who text while they are driving not only causes harm to other drivers but has led to higher auto insurance rates.
- 660,000 Americans are using cell phones or electronic devices while driving—at any given daytime moment.15
- Teen drivers and young adults are at the greatest risk for distracted driving. Among drivers involved in fatal crashes, drivers age 15 to 19 were most likely to be distracted, according to NHTSA.16
- Most U.S. states have legislation banning the use of cell phones while driving instead of broader bans on distracted driving. Twenty-four states ban the use of handheld devices while driving, 20 states ban cell phone use while driving and 48 states ban texting. Missouri and Montana are the two states that don’t ban texting while behind the wheel.17
More fatigued
Drowsy driving, or driver fatigue, is the act of operating a motor vehicle when the driver is tired and has not had enough sleep. Medications, untreated sleep disorders and unpredictable sleep or work schedules can also contribute to driving while fatigued. Reaction time, inability to focus, judgment of speed and/or distance are some of the main effects of driving while sleepy.
- According to the National Highway Traffic Safety Administration, police report around 100,000 drowsy driving crashes annually, resulting in 50,000 injuries and 800 fatalities.18
- However, a study by the AAA Foundation for Traffic Safety concluded that 328,000 drowsy driving crashes happen each year. This is more than three times the number of crashes reported by police.19
- Injuries were recorded in 109,000 of those drowsy driving crashes reported and 6,400 of the crashes were fatal. The prevalence of drowsy driving fatalities is more than 350% greater than reported, according to researchers.20
More fatalities
Despite a reduction in driving early-on in the pandemic, consumers got back on the roads when they could, in record numbers. Incidents of speeding and driving without a seatbelt were reported to be higher than before the pandemic, contributing to a rise in fatalities. Between January and June 2021, the U.S. Department of Transportation’s National Highway Traffic Safety Administration reported the largest six-month increase ever recorded in the Fatality Analysis Reporting System’s history.
- From January through November 2021, the number of deaths is estimated to be 42,310. This estimate is up 9% compared to 2020 and up 18% compared to 2019.21
- The surge in motor vehicle deaths marks the largest increase in fatalities since 1940s and a sharp change from 2019, where the annual death rate was near its lowest level since the 1920s.22
Working with an independent agent will help ensure you have coverage that’s the right combination of price, protection and value with The Hanover’s suite of products. By bundling your coverage with Hanover Platinum or Hanover Prestige (for higher-value vehicles), you can have product suites that fit your needs and help you stay protected.
Questions? Contact your independent agent to learn more.
Sources
[1] Fortune [2-3] CNBC [4-6] CCC Intelligent Solutions industry update – August 2021 [7] TechForce Foundation [8] Car & Driver [9] Auto Rental News [10] Mitchell [11-13] CCC Intelligent Solutions industry update – August 2021 [14] Claims Journal [15-16] NHTSA survey [17] Bankrate [18] NSC [19] AAA Foundation for Traffic Safety [20] NSC [21] NSC Injury facts – Nov 2021 [22] New York Times
Related resources
Why are insurance costs rising for drivers?
Nationwide trends are impacting many industries, including insurance.
Not only are home insurance rates rising, but auto insurance rates are also increasing. Even with a clean driving record and no recent claims, you may see a higher premium for your auto insurance.
How are auto insurance rates determined?
There are several standard factors that influence auto insurance premiums. Rates are determined by the likelihood of a consumer filing a claim and the possible risks involved. Auto insurance rates are also driven by:
- Level of insurance coverage needed
- Number of car insurance claims
- Deductible amount
- Demographics
- Driving history
- Location
There are other influencers caused by national trends which also contribute to rates, the biggest cause being the rise in inflation. When prices rise, the cost of living and owning a car increases, which in turn influences auto insurance rates. These rate increases are happening to insurance companies across the U.S.
We have put together an overview of some current trends to help show you what is causing auto insurance rates to rise. An infographic of Why are insurance costs rising for drivers? is also available.
Jump to: More demand | More expensive | More rentals | More technology | More claims | More distracted | More fatigued | More fatalities
More demand
Once buying habits started to change after the uncertainty of 2020, the auto industry was unable to keep up with consumer demand due to semiconductor chip shortages and supply chain issues. New cars became harder to find and inventory was scarce. This combination of events caused prices for new cars to increase. With less new cars for sale, there has become a shortage of used cars, which saw an even greater price jump.
- Prices for used cars are up a staggering 39.8% since March of 2020, according to the U.S. Bureau of Labor Statistics’ Consumer Price Index. The BLS inflation measurement for new car prices during that same period is up 8.9%.1
- An estimated 57% of new cars sold within 10 days of being delivered in December 2021, as reported by J.D. Power. Additionally, the time it takes for a new car to sell is averaging a new low of 17 days, down from 49 days in 2020.2
- Demand for used cars is also up, as costs have risen to an average of $29,011, up 27.9% from 2020, according to Edmunds’ data.3
More expensive
As a result of more demand and less cars available for purchase, a larger number of drivers have taken to repairing their existing vehicles rather than opting for a new model. Repair costs, however, have also gone up. Older cars face higher repair prices as well as additional maintenance services. Also, a shrinking labor market due to retirement is driving up labor costs.
- The average total cost of vehicle repairs has climbed 22% over the past five years, jumping from $2,858 in March 2016 to $3,480 in February 2021.4
- Labor increased 1.5 hours per claim with an average hourly rate increase of 8.2%.5
- Windshield prices are up 15%, hoods increased 9%, lift gates 8% and front bumpers and fenders increased 7%.6
- According to the 2020 Transportation Technician Supply & Demand Report at TechForce Foundation, the supply of auto repair technicians has fallen behind demand by 3 to 1. The report estimates that 642,000 technicians will be needed between 2020 and 2024, with an inadequate pipeline of new trainees filling this demand.7
More rentals
With a nationwide shortage of cars to purchase, rental fleets have also been struggling. The supply chain issues and chip shortages have led rental agencies to bid for cars and compete with consumer demand. With smaller fleets, there are less cars to rent, leading to higher rental prices.
- Data from travel company Kayak reveals that the average daily rental rate for a car in the U.S. in December 2021 was $81. That is up 31% from the year prior and up even more since December 2019 when the average rental rate was around $46.8
- Auto Rental News reports that a total of 726,056 new cars were added to the U.S. rental car industry throughout 2021. This is only a 9% drop from 2020 but is a 58% drop from 2019 when the industry added almost 1,739,000 new vehicles.9
More technology
Cars are becoming more advanced each year. Electric vehicles with wireless charging stations are everywhere. Some newer cars have xenon headlights, 360-degree cameras, emergency braking with pedestrian detection, direct adaptive steering and more. All these technological breakthroughs add to the price of a vehicle and factor into replacement costs in the event of a loss.
- High-tech auto parts (xenon headlights, sensors, cameras, etc.) have resulted in an average increase in claim costs of almost $300 in the last 5 years.10
More claims
An increase in auto accidents has resulted in more and higher claims filed. With complex vehicle technology, replacement parts are becoming more expensive. Much of the price increases are due to supply chain disruptions and worker shortages. This has resulted in total loss costs at some of the highest levels they’ve been at in years.
- Over a 5-year period, total loss frequency has climbed 4.1%.11
- According to a report by CCC Intelligent Solutions, the percentage of collision claims where the vehicle was rendered non-drivable was greater in every month of 2021 compared the same month in 2020 and 2019. The increase was even more evident for liability claims, where the percentage of non-drivable accidents was nearly 25% during much of 2021, compared to about 20 to 21% in 2019.12
- CCC shows that the average total loss claim cost climbed from slightly less than $8,000 in 2010 to slightly less than $10,000 in 2020, then jumped to more than $12,000 in 2021.The steady increase in vehicle replacement cost has been attributed to the growing complexity of automobiles during that time period.13
- Vehicles are also taking longer to repair. Repair shops were reported to have a backlog of 2.6 weeks during the third quarter of 2021, which was a week longer than in the second quarter of 2021. During the third quarter of 2019, the average backlog was 1.7 weeks.14
More distracted
Taking your eyes off the road while driving, for even a few seconds, can have disastrous consequences. The rising number of drivers who text while they are driving not only causes harm to other drivers but has led to higher auto insurance rates.
- 660,000 Americans are using cell phones or electronic devices while driving—at any given daytime moment.15
- Teen drivers and young adults are at the greatest risk for distracted driving. Among drivers involved in fatal crashes, drivers age 15 to 19 were most likely to be distracted, according to NHTSA.16
- Most U.S. states have legislation banning the use of cell phones while driving instead of broader bans on distracted driving. Twenty-four states ban the use of handheld devices while driving, 20 states ban cell phone use while driving and 48 states ban texting. Missouri and Montana are the two states that don’t ban texting while behind the wheel.17
More fatigued
Drowsy driving, or driver fatigue, is the act of operating a motor vehicle when the driver is tired and has not had enough sleep. Medications, untreated sleep disorders and unpredictable sleep or work schedules can also contribute to driving while fatigued. Reaction time, inability to focus, judgment of speed and/or distance are some of the main effects of driving while sleepy.
- According to the National Highway Traffic Safety Administration, police report around 100,000 drowsy driving crashes annually, resulting in 50,000 injuries and 800 fatalities.18
- However, a study by the AAA Foundation for Traffic Safety concluded that 328,000 drowsy driving crashes happen each year. This is more than three times the number of crashes reported by police.19
- Injuries were recorded in 109,000 of those drowsy driving crashes reported and 6,400 of the crashes were fatal. The prevalence of drowsy driving fatalities is more than 350% greater than reported, according to researchers.20
More fatalities
Despite a reduction in driving early-on in the pandemic, consumers got back on the roads when they could, in record numbers. Incidents of speeding and driving without a seatbelt were reported to be higher than before the pandemic, contributing to a rise in fatalities. Between January and June 2021, the U.S. Department of Transportation’s National Highway Traffic Safety Administration reported the largest six-month increase ever recorded in the Fatality Analysis Reporting System’s history.
- From January through November 2021, the number of deaths is estimated to be 42,310. This estimate is up 9% compared to 2020 and up 18% compared to 2019.21
- The surge in motor vehicle deaths marks the largest increase in fatalities since 1940s and a sharp change from 2019, where the annual death rate was near its lowest level since the 1920s.22
Working with an independent agent will help ensure you have coverage that’s the right combination of price, protection and value with The Hanover’s suite of products. By bundling your coverage with Hanover Platinum or Hanover Prestige (for higher-value vehicles), you can have product suites that fit your needs and help you stay protected.
Questions? Contact your independent agent to learn more.
Sources
[1] Fortune [2-3] CNBC [4-6] CCC Intelligent Solutions industry update – August 2021 [7] TechForce Foundation [8] Car & Driver [9] Auto Rental News [10] Mitchell [11-13] CCC Intelligent Solutions industry update – August 2021 [14] Claims Journal [15-16] NHTSA survey [17] Bankrate [18] NSC [19] AAA Foundation for Traffic Safety [20] NSC [21] NSC Injury facts – Nov 2021 [22] New York Times